_____
____
___
__
_
|
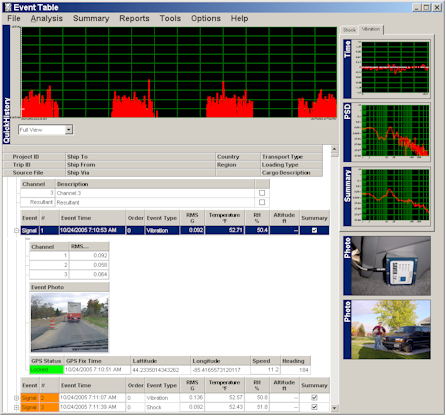
Google Earth One of the things that I do for a living is create software for analyzing dynamic events. The stuff that happens as you drive down the road, fly through the air, or travel over the rails. You know, the accelerations that get classified as shock and vibration. Below are some example KML files for Google Earth that demonstrate the dynamic intensity of road conditions. In essence, you can measure how rough the ride is as you drive along so that you can later reproduce it in the Lab. To create these files, data was captured with a Shock And Vibration Environment Recorder mounted to my vehicle. The SAVER continuously monitors a suite of sensors including Acceleration, Temperature, Humidity and GPS data streams indicating how the vehicle is traveling. When an event is detected, the data is stored to flash memory for later analysis. Each event is represented by a vertical bar placed at the location on the earth where the event occurred. The height (altitude) of the bar is proportional to the intensity of the event. Think of it as SaverXware's QuickHistory view (seen here to the right), but in 3D and spread over the world. A virtual camera view is attached to each event and is projected relative to the travel heading at the time the event was recorded. Have FUN and explore the demonstration files!
|
|